The Biggest Risk of Early Retirement (FIRE) – Sequence of Returns!

The dream of Financial Independence, Retire Early (FIRE) is everywhere these days (it wasn’t so common when I started my journey almost two decades ago).
But here’s the thing most FIRE “influencers” don’t like to dwell on: retiring early comes with a unique headache – what’s known as sequence of returns risk.
Sequence of returns risk is the worst-case scenario when your investment portfolio takes a hit early in retirement. And if you’re planning on living off that nest egg for 40 or 50 years, a few bad years at the start can do a lot more damage than most spreadsheets account for.
The earlier the retirement, the longer the portfolio has to last. We take an in-depth look here at safe withdrawal rates for early retirement, but for now let’s just focus on the specific problem of Sequence of Returns Risk. Afterall, it’s not just about how much you save. It’s about what happens when the market decides to punch you in the face.
Sure, the 4% rule and saving 25x your earnings are good starting points. But they don’t really address the unique concerns of early retirees who might be looking at 50+ years of retirement!
Are You Saving Enough for Retirement?
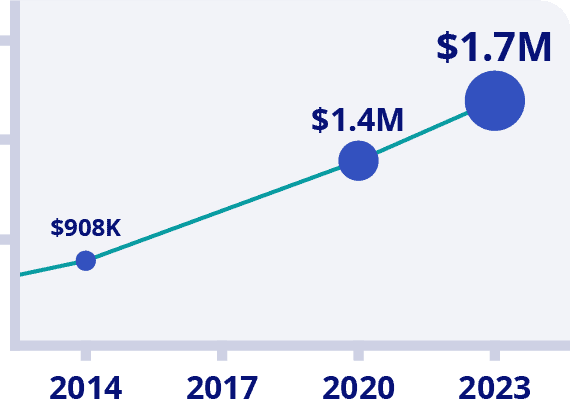
Canadians Believe They Need a $1.7 Million Nest Egg to Retire
Is Your Retirement On Track?
Become your own financial planner with the first ever online retirement course created exclusively for Canadians.
Try Now With 100% Money Back Guarantee*Data Source: BMO Retirement Survey
What is The 4% Rule
Let’s rewind a little and get into the background of the 4% rule. As mentioned, some people assume that a 4% withdrawal from your retirement is super safe for the rest of your retirement life. However, the devil is in the details.
The 4% rule is the percentage of your portfolio that you can withdraw / year while keeping the balance intact. This is assuming that you stay invested in the market with balanced asset allocation.
According to William Bengen, CFP, 4% of your portfolio can be withdrawn from your portfolio (increasing with inflation annually) while keeping your portfolio intact for 30 years with high certainty. This is assuming a 50/50 equities/bond asset mix during retirement.
The rub is that “high certainty” does not mean 100%. According to this Vanguard Monte Carlo Simulator, a mix of 50% stocks/50% bonds and 4% withdrawal rate results in a 92% probability of the portfolio lasting 30 years.
Increase the timeline to 50 years, like with early retirement, and the probability drops to 78%. Would you be comfortable knowing that your portfolio has a 78% chance of survival?
With all the talk about 6% long-term returns, wouldn’t a 4% withdrawal rate last forever? That’s where the risk of the sequence of returns kicks in. Perhaps the biggest risk to retirees, especially early retirees.
Sequence of Returns
As you know, the stock market has varying returns every year. Over the long-term, the returns go up, but it usually moves in a jigsaw pattern while on its way. The varying annual returns are called the sequence of returns.
The pattern of the sequence of returns doesn’t matter as much during the accumulation phase because new money/savings is entering the account. In fact, adding to investments when markets are down is a surefire way to boost your long term returns.
However, the sequence of returns matters during the decumulation/retirement phase because money is coming out of the portfolio without new deposits. This is especially harmful if a bear market occurs at the beginning of retirement and regular withdrawals are needed to pay for fixed expenses.
Examples
The best way to show the risk of the sequence of returns is through some examples of how it works and how it can impact your portfolio.
Assumptions:
- $1M portfolio (100% equities);
- 4% withdrawals, increasing with inflation (assume 2%)
- Withdrawals are made at the end of the year
Straight 6% Return
With a straight 6% return every year, a 4% withdrawal, increasing every year with inflation is no problem. Starting with a $1M portfolio, even after withdrawals, the portfolio has grown to $1.8M. Sign me up!
| Year | Return | Withdrawal | Balance | Actual Withdrawal Rate |
| 1 | 6.00% | $40,000.00 | $1,020,000.00 | 3.92% |
| 2 | 6.00% | $40,800.00 | $1,040,400.00 | 3.92% |
| 3 | 6.00% | $41,616.00 | $1,061,208.00 | 3.92% |
| 4 | 6.00% | $42,448.32 | $1,082,432.16 | 3.92% |
| 5 | 6.00% | $43,297.29 | $1,104,080.80 | 3.92% |
| 6 | 6.00% | $44,163.23 | $1,126,162.42 | 3.92% |
| 7 | 6.00% | $45,046.50 | $1,148,685.67 | 3.92% |
| 8 | 6.00% | $45,947.43 | $1,171,659.38 | 3.92% |
| 9 | 6.00% | $46,866.38 | $1,195,092.57 | 3.92% |
| 10 | 6.00% | $47,803.70 | $1,218,994.42 | 3.92% |
| 11 | 6.00% | $48,759.78 | $1,243,374.31 | 3.92% |
| 12 | 6.00% | $49,734.97 | $1,268,241.79 | 3.92% |
| 13 | 6.00% | $50,729.67 | $1,293,606.63 | 3.92% |
| 14 | 6.00% | $51,744.27 | $1,319,478.76 | 3.92% |
| 15 | 6.00% | $52,779.15 | $1,345,868.34 | 3.92% |
| 16 | 6.00% | $53,834.73 | $1,372,785.71 | 3.92% |
| 17 | 6.00% | $54,911.43 | $1,400,241.42 | 3.92% |
| 18 | 6.00% | $56,009.66 | $1,428,246.25 | 3.92% |
| 19 | 6.00% | $57,129.85 | $1,456,811.17 | 3.92% |
| 20 | 6.00% | $58,272.45 | $1,485,947.40 | 3.92% |
| 21 | 6.00% | $59,437.90 | $1,515,666.34 | 3.92% |
| 22 | 6.00% | $60,626.65 | $1,545,979.67 | 3.92% |
| 23 | 6.00% | $61,839.19 | $1,576,899.26 | 3.92% |
| 24 | 6.00% | $63,075.97 | $1,608,437.25 | 3.92% |
| 25 | 6.00% | $64,337.49 | $1,640,605.99 | 3.92% |
| 26 | 6.00% | $65,624.24 | $1,673,418.11 | 3.92% |
| 27 | 6.00% | $66,936.72 | $1,706,886.48 | 3.92% |
| 28 | 6.00% | $68,275.46 | $1,741,024.21 | 3.92% |
| 29 | 6.00% | $69,640.97 | $1,775,844.69 | 3.92% |
| 30 | 6.00% | $71,033.79 | $1,811,361.58 | 3.92% |
If only real life were so straight forward! Unfortunately, the market is highly variable and a large drop at the beginning of retirement can be damaging.
35% Market Drop Followed By a Constant 6% Return
Let’s take a look at another example with a large 35% drop (like in 2008) at the beginning of retirement and a constant return after.
In the table below, notice that a $1M equity portfolio would have dropped to $650,000, then another $40,000 withdrawn to fund retirement. Even with a healthy 6% return that follows annually, it’s not enough to recover from the damage. This portfolio would have run out of money by year 25.
Fortunately, large market drops have historically been followed by big market gains which help the portfolio recover.
| Year | Return | Withdrawal | Balance | Actual Withdrawal Rate |
| 1 | -35.00% | $40,000.00 | $610,000.00 | 6.56% |
| 2 | 6.00% | $40,800.00 | $605,800.00 | 6.73% |
| 3 | 6.00% | $41,616.00 | $600,532.00 | 6.93% |
| 4 | 6.00% | $42,448.32 | $594,115.60 | 7.14% |
| 5 | 6.00% | $43,297.29 | $586,465.25 | 7.38% |
| 6 | 6.00% | $44,163.23 | $577,489.93 | 7.65% |
| 7 | 6.00% | $45,046.50 | $567,092.83 | 7.94% |
| 8 | 6.00% | $45,947.43 | $555,170.97 | 8.28% |
| 9 | 6.00% | $46,866.38 | $541,614.86 | 8.65% |
| 10 | 6.00% | $47,803.70 | $526,308.05 | 9.08% |
| 11 | 6.00% | $48,759.78 | $509,126.75 | 9.58% |
| 12 | 6.00% | $49,734.97 | $489,939.39 | 10.15% |
| 13 | 6.00% | $50,729.67 | $468,606.08 | 10.83% |
| 14 | 6.00% | $51,744.27 | $444,978.18 | 11.63% |
| 15 | 6.00% | $52,779.15 | $418,897.72 | 12.60% |
| 16 | 6.00% | $53,834.73 | $390,196.85 | 13.80% |
| 17 | 6.00% | $54,911.43 | $358,697.23 | 15.31% |
| 18 | 6.00% | $56,009.66 | $324,209.41 | 17.28% |
| 19 | 6.00% | $57,129.85 | $286,532.12 | 19.94% |
| 20 | 6.00% | $58,272.45 | $245,451.60 | 23.74% |
| 21 | 6.00% | $59,437.90 | $200,740.80 | 29.61% |
| 22 | 6.00% | $60,626.65 | $152,158.59 | 39.84% |
| 23 | 6.00% | $61,839.19 | $99,448.92 | 62.18% |
| 24 | 6.00% | $63,075.97 | $42,339.89 | 148.98% |
6% Return And 35% Market Drop At Year 15
The main idea is that big market drops at the beginning of retirement are the most damaging. This is a third example showing a big market drop at year 15 but constant return otherwise.
Although the portfolio survives until year 30, it taps out at year 39.
| Year | Return | Withdrawal | Balance | Actual Withdrawal Rate |
| 1 | 6.00% | $40,000.00 | $1,020,000.00 | 3.92% |
| 2 | 6.00% | $40,800.00 | $1,040,400.00 | 3.92% |
| 3 | 6.00% | $41,616.00 | $1,061,208.00 | 3.92% |
| 4 | 6.00% | $42,448.32 | $1,082,432.16 | 3.92% |
| 5 | 6.00% | $43,297.29 | $1,104,080.80 | 3.92% |
| 6 | 6.00% | $44,163.23 | $1,126,162.42 | 3.92% |
| 7 | 6.00% | $45,046.50 | $1,148,685.67 | 3.92% |
| 8 | 6.00% | $45,947.43 | $1,171,659.38 | 3.92% |
| 9 | 6.00% | $46,866.38 | $1,195,092.57 | 3.92% |
| 10 | 6.00% | $47,803.70 | $1,218,994.42 | 3.92% |
| 11 | 6.00% | $48,759.78 | $1,243,374.31 | 3.92% |
| 12 | 6.00% | $49,734.97 | $1,268,241.79 | 3.92% |
| 13 | 6.00% | $50,729.67 | $1,293,606.63 | 3.92% |
| 14 | 6.00% | $51,744.27 | $1,319,478.76 | 3.92% |
| 15 | -35.00% | $52,779.15 | $804,882.05 | 6.56% |
| 16 | 6.00% | $53,834.73 | $799,340.23 | 6.73% |
| 17 | 6.00% | $54,911.43 | $792,389.22 | 6.93% |
| 18 | 6.00% | $56,009.66 | $783,922.92 | 7.14% |
| 19 | 6.00% | $57,129.85 | $773,828.44 | 7.38% |
| 20 | 6.00% | $58,272.45 | $761,985.70 | 7.65% |
| 21 | 6.00% | $59,437.90 | $748,266.95 | 7.94% |
| 22 | 6.00% | $60,626.65 | $732,536.31 | 8.28% |
| 23 | 6.00% | $61,839.19 | $714,649.30 | 8.65% |
| 24 | 6.00% | $63,075.97 | $694,452.29 | 9.08% |
| 25 | 6.00% | $64,337.49 | $671,781.94 | 9.58% |
| 26 | 6.00% | $65,624.24 | $646,464.61 | 10.15% |
| 27 | 6.00% | $66,936.72 | $618,315.77 | 10.83% |
| 28 | 6.00% | $68,275.46 | $587,139.25 | 11.63% |
| 29 | 6.00% | $69,640.97 | $552,726.64 | 12.60% |
| 30 | 6.00% | $71,033.79 | $514,856.45 | 13.80% |
Using Real Returns
Instead of using hypothetical returns, what if we used historical returns instead? I used a series of historical returns in sequence, and it appeared that most 30 year periods were safe from ruin. Best bet would be to run the Vanguard Monte Carlo simulation above that randomizes historical returns.
But what if we picked a tough market period like starting retirement in year 2000? What would the portfolio look like in 2018? Looking at the table below, it looks like the portfolio survived the dot com crash and 2008 financial crisis. As you can see, following big down years came big up years as well. As you can see, the market has been very kind since 2009.
What happens after year 19 remains to be seen. With a hot streak of winning years (except 2018), a correction is long overdue.
| Year | Return | Withdrawal | Balance |
| 1 | -7.64% | $40,000.00 | $883,600.00 |
| 2 | -10.54% | $40,800.00 | $749,668.56 |
| 3 | -20.87% | $41,616.00 | $551,596.73 |
| 4 | 28.88% | $42,448.32 | $668,449.55 |
| 5 | 11.49% | $43,297.29 | $701,957.11 |
| 6 | 5.50% | $44,163.23 | $696,401.52 |
| 7 | 16.12% | $45,046.50 | $763,614.95 |
| 8 | 6.03% | $45,947.43 | $763,713.51 |
| 9 | -35.99% | $46,866.38 | $441,986.64 |
| 10 | 25.95% | $47,803.70 | $508,878.47 |
| 11 | 15.28% | $48,759.78 | $537,875.32 |
| 12 | 2.50% | $49,734.97 | $501,587.24 |
| 13 | 15.91% | $50,729.67 | $530,660.09 |
| 14 | 32.10% | $51,744.27 | $649,257.72 |
| 15 | 13.89% | $52,779.15 | $686,660.46 |
| 16 | 1.77% | $53,834.73 | $644,979.62 |
| 17 | 12.04% | $54,911.43 | $667,723.74 |
| 18 | 21.92% | $56,009.66 | $758,079.13 |
| 19 | -3.74% | $57,129.85 | $672,597.12 |
How To Avoid The Risks Of Early Retirement
While the sequence of returns risk is real, the bright side is that probabilities are strongly on your side, even as a very early retiree. As you know, historical returns do not equate to future returns. It’s possible that we endure a prolonged multi-year bear market without significant recovery years that could be disastrous to a new retiree. However, as my co-host Kyle Prevost writes, in his article asking How Much Do Canadians Spend in Retirement, it’s much more probable that you’ll pass away with more money than you started with – even if you retire early!
Being the conservative investor that I am, I like to reduce risk as much as possible. Having said that, here are some ways to reduce the sequence of returns risk.
1) Proper Asset Allocation – Although my examples above use 100% equities, it is not recommended to hold 100% equities during retirement. Volatility pre-retirement is more of a gut-check, but having large swings in portfolio value during retirement withdrawals can result in sustainability issues. You want a balance of enough growth combined with less volatility. See our list of the best ETFs in Canada for a look at the most efficient ways to get diversified growth and fixed income options.
2) Variable Withdrawals – Consider withdrawing a maximum of 4% of your portfolio balance at the end of the year instead of a fixed amount. For example, instead of withdrawing $40k every year from a $1M portfolio, go with the flow of the market. So if your portfolio value drops to $900k one year, withdraw 4% of $900k instead ($36k instead of $40k). Basically, during negative return years, consider withdrawing less from your portfolio. This would mean variable withdrawals but would result in a sustainable portfolio over the long term.
3) Buy an Annuity – If steady payments are a requirement, consider using a portion of your retirement funds to buy an annuity. In exchange for your capital, the annuity will give you steady cash flow for life. Also, don’t forget to count CPP and OAS into your calculations which are basically annuities that start in your 60’s. Check our list of useful retirement calculators to see how much you need to retire safely.
4) Save a Little Cash before Retirement – Another strategy that resonates with me is to save up to 18 months of retirement expenses prior to retirement. Use the cash for everyday spending, but use variable annual withdrawals (like in #2 above) from your portfolio to top up your cash on an annual basis. The 2x cash acts as a buffer against major market downturns. I personally keep mine in the EQ Bank Notice Account that we talk about in our EQ Bank Review.
5) Spend Distributions Only – My strategy for early retirement is to spend the distributions (dividends) but maintain the capital. In other words, spend the golden eggs, but take care of the goose! However, the downside is that you’ll need a larger portfolio. I know Kyle would point out that this is probably needlessly conservative, but I think it has a great psychological component for at least the first few years of early retirement. If it helps me get through the Sequence of Retirement Risk vulnerability period, then I’m up for saving a little more. Check my list of the best Canadian dividend stocks for more on how I prioritize dividend yield growth with part of my portfolio.
6) Get a Side Gig – For early retirees, one way to stay engaged and to take some pressure off the portfolio is to get a part-time job or business. For FIRE bloggers, most will continue running their business which may end up making more than enough to pay for already low annual expenses.
7) Spend Time Abroad – Most people would think that travelling would increase your spending, and consequently increase your sequence of returns risk for early retirees. That might be true if luxury travel is your thing, but as Kyle wrote in his article on the Best Countries for Canadians to Retire Abroad, there are many low-cost countries out there that can stretch a decreased portfolio much further! This is even easier for early retirees to take advantage of than “standard retirees” because in theory medical needs should be substantial for these folks.
Final Thoughts: Sequence of Returns Is the FIRE Kill Switch (If You Let It Be)
Retiring early isn’t just about having a big number in your bank account. It’s about surviving the first five-to-ten years without panicking, or accidentally blowing up your withdrawal plan.
Sequence of returns risk is all about the worst case scenario. You can average 7% returns over 40 years, but if you hit a rough patch in the first few, those early withdrawals hurt a lot more than most people realize. You’re selling more shares while prices are low, and that creates a compounding problem in the wrong direction.
But here’s the good news: the solution isn’t complicated.
- Build a flexible withdrawal plan (not a fixed rule).
- Keep a couple years of cash in high interest savings accounts or GICs on hand so you don’t have to sell in a crash.
- Stay invested – don’t bail when things look ugly.
- Use the best Canadian online brokerages to cut investing fees mercilessly.
The math behind FIRE can work. But only if you’ve accounted for the real-world gut punch that is early market volatility. Remember that the 4% rule was created with a 30-year retirement in mind.
The sequence of returns risk is real – but so is the joy that comes with early retirement and/or financial independence. Don’t let fear of running out prevent you from pursuing freedom sooner rather than later. Instead, take concrete steps to address the risk, and then get on with the more important things in life!
Are You Saving Enough for Retirement?
Canadians Believe They Need a $1.7 Million Nest Egg to Retire
Is Your Retirement On Track?
Become your own financial planner with the first ever online retirement course created exclusively for Canadians.
Try Now With 100% Money Back Guarantee*Data Source: BMO Retirement Survey


Nobody seems to consider the effects of inflation on the income needed. After 30 years with a 3% inflation the equivalent of the $40,000 in today’s money would be $97,000, so the $71,000 in the table above is totally insufficient.
The present-day equivalent of the $71,000 would be approximately $29,000 in today’s money.
Is one able to live on that comfortably in old age? Debatable.
Bank of Canada targets 2% inflation. US Fed Reserve target 2% inflation. Numbers above include 2% inflation.
RK
The 71k is based on 2% inflation which sounds quite reasonable. For reference, the Average Annual Rate of Inflation for the last 30 years (May 1989 – May 2019) is 2.04%. Unless the BoC’s primary responsibility is changed, it would take a major global catastrophe to push long term average inflation back up to the 3% range.
To be honest, I don’t find the “2%” inflation realistic. What I find realistic is comparing my regular expenses (including food, energy and etc) vs my previous years. When I do that, my expenses are increasing much higher than 2%.
Just look at basic needs:
Place to live (real estate/rent prices in your city)
Food prices
Energy prices
And etc
Where did these real return numbers come from? SP500 2018 was -4.38% with Dividends, 2008 was -37%, etc…
As you can see, using real returns, the portfolio is still strong, and that money could last for the next 50 years! FIRE @ age 40, live till age 90.
Over a 20 year and 25 year period, the Market, delivers. Enjoy the bull market. At this rate, we will end the year with a +40% return ;)
RK
Good points Rahim. Historically, it has worked out, but as you know, past returns does not mean the future will hold the same. However, the patterns tend to repeat themselves (ie. a big drop is followed by big gains).
Where did your real return numbers come from?!
If you can’t rely on past data, what can you rely on…. It’s all we have to rely on ;)
RK
I used this and added a 2.5% dividend for total return: https://www.macrotrends.net/2526/sp-500-historical-annual-returns
Use this instead:
https://en.wikipedia.org/wiki/S%26P_500_Index
Interestingly enough, the 20 year annualized rate of return for the market is 5.62% currently. It’s the lowest ever. Add 5 more years and you are up to 9.02%.
All you need is 6% consistently a year and you are set ~
RK
Hello FT,
You should use these Total Annual Returns including Dividends:
https://en.wikipedia.org/wiki/S%26P_500_Index
Thanks, RK
Thanks Rahim, will take a look!
The largest problem with these returns analysis is that a successful scenario in the simulator is one where you have >0 left at the end or more money than you started with in nominal terms after 30 years. I wouldn’t count that as success because $1m after 30 years is not the same as $1m now. Success would be if in real terms you had more than at start date. Doing that analysis drops the success rate way way down, because inflation can deviate from market returns for significant periods of time.
Secondly, I’d disagree, 80% success rate is a decent enough rate of success, because the rate of country failure is higher than 20%, as is your probability of death as you go past 65. Unfortunately working to get 100% financial success means you actually shouldn’t ever retire which is not a choice I want to pursue.
Hi Bob, not sure I understand. In a typical retirement scenario, 30 years is essentially the date of death. Are you saying that success would be if you have a large estate to transfer to the next generation?
Here is one withdrawal strategy I like for retirement:
https://www.finiki.org/wiki/Variable_percentage_withdrawal
For myself, same plan here as FT, eating the golden eggs, leave the geese alone. I would like to retire when investment income cover my annual expense which covers everything not only core expense. So if market is bad, hopefully investment income stays the same. If some dividends get slashed or eliminated, hopefully rest of it still covers the core expense and I can easily cut travelling and eating out, shopping chicken legs instead of steaks etc. I will also keep some FI assets, so if it still does not work, then I can sell some FI, instead of equities.
But if the world comes to an end, nobody can do anything about it. So as human beings, there is nothing as 100% guarantee.
Thanks for the link May, really good stuff. We seem to have the same investment philosophy! Have you calculated when approximate FI will be achieved?
If everything goes smoothly, we should be able to achieve it in three years in case both of use continue to work. 5 years if one of us retires soon.
The scenarios you are using are self-fulfilling prophecies for the F.I.R.E. advocates because you are not taking into account major secular bear markets (don’t happen often but when they do, it’s game over).
To be fair, you should run your FIRE scenario when retirement happens to occur just at the peak of the stock market when a secular bear is just starting… i.e. US market 1932-1954 and Japanese market 1989-2019.
A retirement fund entirely invested in equities (with no addition of capital because one is in the retirement withdrawal phase) runs out of money very fast (even dividends are slashed or eliminated altogether) and one is left holding the brown bag.
That is why you need to commit a fairly large portion of your nest-egg to interest paying instruments (bonds, real estate, T-Bills, etc…) not correlated or very weakly correlated to the behavior of stock the market.
Even “diversification” of your equities portfolio across world stock markets does not provide anymore “safety” since all those markets now are interdependent and react identically when a downturn occurs.
This means that you need 2 to 3 times more money in your nest egg than originally anticipated (and most FIRE disciples underestimate this by a significant margin !).
It is better to plan accordingly even if you hate your job and have to work a few more years to avoid being caught with your pants down !
Try to find a “good” paying job in your 50’s, 60’s or 70’s after having been off the workforce for 10 to 20 years and you’ll see that it is just not going to happen… Greeting Walmart customers in your 70’s, 40 hours a week, might not be the ideal retirement you had “planned for” in your late 30’s when you said “bye bye boss, I’m never coming back again, I’m now retired !”
Better SAFE than SORRY !
Thanks John, I agree to be better safe than sorry and reduce withdrawals during down years. Even still, most people who are FIRE have a side gig that produces income and reduces the reliance on their portfolio. In my opinion, that’ s a smart move!
Thanks for this post – Great to see a more realistic and detailed look into the 4% rule and actual returns.
The point of the post is to really challenge your assumptions. Too many people/bloggers simply assume that 4% rule is forever with 100% gaurantee. While historically it was a relatively safe bet, it’s better to go into retirement with eyes open. I like the 4% rule during up years, but reducing withdrawals during down years.